
When a futures market starts moving, price alone does not tell the entire story.
A market can move on relatively light trading activity or it can move as volume expands sharply. Those two situations may look similar on a price chart but they do not necessarily provide the same information.
That is why I want traders to ask a second question:
Is greater trading activity accompanying the price move?
Our InsigniaTrader Pro platform includes three indicators that can help answer that question:
- VWAP, or Volume Weighted Average Price
- Volume
- SMAV, or Simple Moving Average of Volume
Used together, these indicators can provide a way to evaluate price direction, recent volume-weighted price and the amount of activity behind a move.
They will not predict what the market will do next or produce an automatic trading signal. Instead, they can provide additional context before a trader makes a decision.
A Three-Indicator Setup in InsigniaTrader Pro
The example in this article uses a five-minute chart of December 2026 E-mini S&P 500 futures from October 14, 2026.
The chart includes:
- A 14-period rolling VWAP
- Five-minute volume
- A 14-period SMAV
InsigniaTrader uses 14 periods as the default setting for VWAP and SMAV. Traders can adjust the period for either indicator.
A shorter period will generally respond more quickly to recent changes. A longer period will create a smoother calculation based on more bars.
We are using 14 periods because it is the platform default and provides a straightforward example that InsigniaTrader users can reproduce. It is not a recommendation or a setting that will be appropriate for every market, timeframe or trading approach.
How InsigniaTrader’s Rolling VWAP Works
VWAP stands for Volume-Weighted Average Price. Unlike a simple moving average that gives each price bar equal weight, VWAP gives greater weight to prices where more contracts traded.
InsigniaTrader allows traders to select the number of periods included in the calculation.
On the five-minute chart used for this article, a 14-period VWAP represents a rolling window of approximately 70 minutes:
14 bars × 5 minutes = 70 minutes
This is different from a session VWAP that begins calculating at a designated session opening and continues accumulating data throughout the day.
InsigniaTrader’s period-based VWAP moves forward with the chart. As a new bar is added, the rolling calculation updates to reflect the most recent 14 bars.
This allows the indicator to respond relatively quickly when price and volume change. It also means that traders need to consider both the period setting and chart timeframe.
For example:
- Fourteen periods on a five-minute chart represent approximately 70 minutes.
- Fourteen periods on a 15-minute chart represent approximately 210 minutes.
- Fourteen periods on a 30-minute chart represent approximately seven hours.
Changing the chart timeframe changes the amount of market activity included in the calculation even when the period remains set at 14.
What Volume and SMAV Tell You
The Volume indicator shows how many contracts traded during each chart bar. On a five-minute chart, each volume bar represents the contracts traded during that five-minute interval.
Volume does not tell you whether every participant was buying or selling. Every completed futures transaction includes both a buyer and a seller.
Volume also does not reveal whether participants are opening new positions, closing existing positions or doing a combination of both.
The CME futures exchange defines volume as the number of contracts traded. Increasing volume can show that more trading activity is occurring but it does not explain why market participants traded or guarantee what price will do next.
SMAV adds context by calculating the simple moving average of volume over the selected number of bars.
A 14-period SMAV on this five-minute chart shows the recent average volume across a rolling 14-bar window. Traders can compare the volume of an individual completed bar with that rolling average.
Using 14 periods for both VWAP and SMAV creates a consistent framework:
- VWAP evaluates volume-weighted price across a rolling 14-bar window.
- SMAV evaluates average volume across a rolling 14-bar window.
- Volume shows the number of contracts traded during each individual bar.
The VWAP and SMAV settings do not have to match. Matching them simply makes this example easier to follow.
A Three-Step Process for Reading the Chart
Instead of treating VWAP as an automatic signal, use these indicators to answer three questions.
1. Where is price relative to rolling VWAP?
Determine whether price is:
- Above VWAP
- Below VWAP
- Repeatedly crossing VWAP
Price above VWAP means it is trading above the volume-weighted average for the selected rolling period. Price below VWAP means it is trading below that average.
Repeated crossings can indicate that the market lacks a sustained direction relative to its recent volume-weighted price.
This observation does not tell you to buy or sell. It establishes the market’s current position relative to its recent activity.
2. What direction is VWAP moving?
Next, look at the slope of the VWAP line.
A rising VWAP indicates that the rolling volume-weighted average is increasing. A declining VWAP indicates that it is decreasing. A relatively flat VWAP may accompany a market that is consolidating or trending sideways.
Price location and VWAP direction are more useful when considered together.
Price holding below a declining VWAP presents a different condition from price briefly falling below a rising VWAP. Likewise, price moving above VWAP while the line remains sharply lower is different from price holding above a VWAP that has flattened and started rising.
3. How does current volume compare with average volume?
Compare the volume of a completed five-minute bar with the 14-period SMAV.
This helps determine whether the price movement is occurring with more or less activity than the recent rolling average.
Always make this comparison with a completed bar. Volume accumulates throughout the interval. A five-minute bar viewed after only two or three minutes cannot be compared fairly with completed five-minute bars.
What the E-mini S&P 500 Chart Shows
The accompanying chart provides several examples of how this process can be applied.
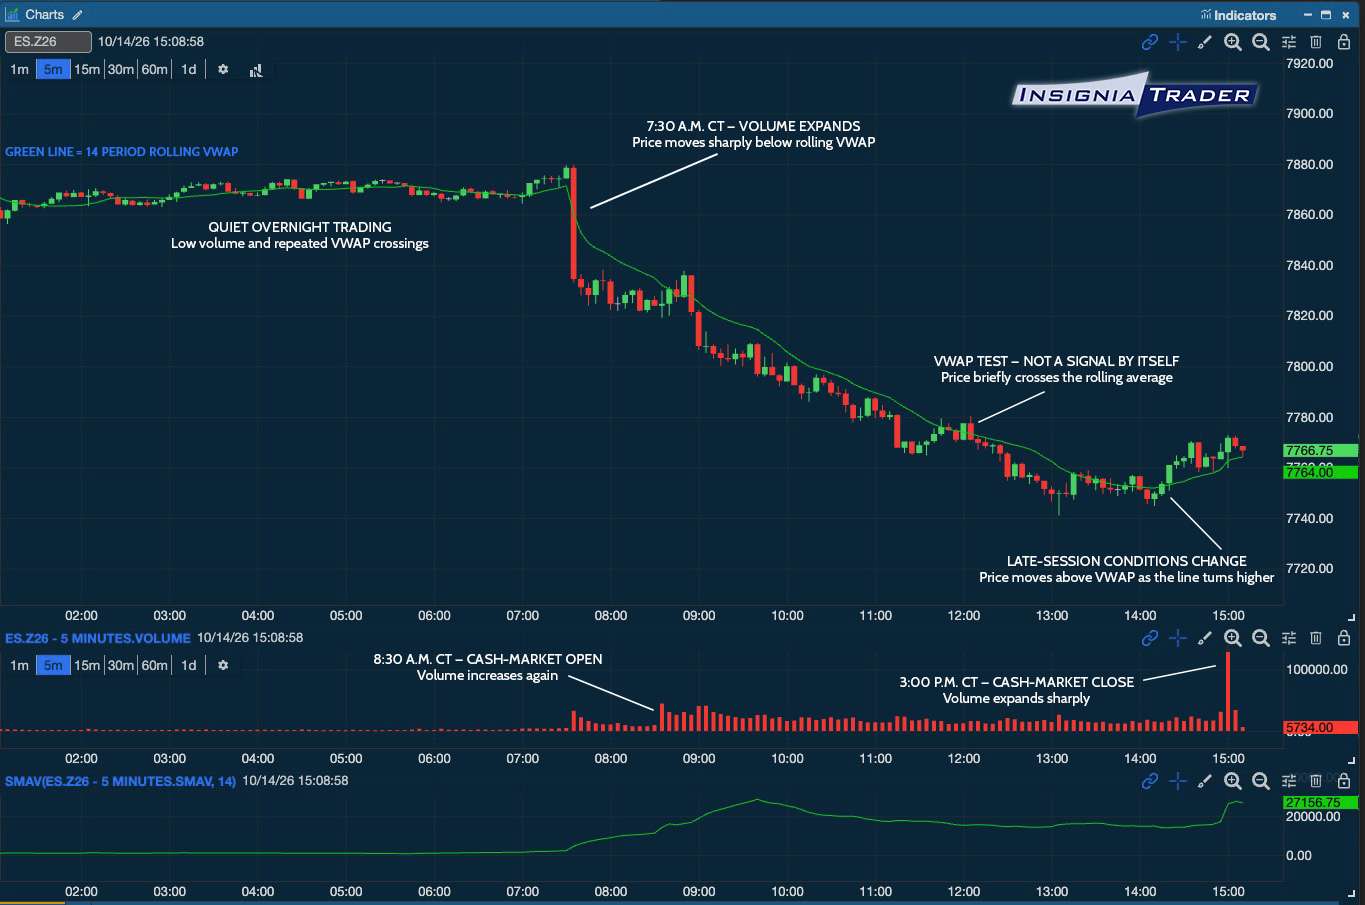
Quiet overnight activity
During the early portion of the chart, E-mini S&P 500 futures traded within a relatively narrow range.
Price crossed the rolling VWAP multiple times while the VWAP remained comparatively flat. Volume was also substantially lower than it would become later in the morning.
These conditions describe a market without a sustained direction relative to its recent volume-weighted average.
A trader reacting to every VWAP crossover could have encountered several changes in direction during this period. The relatively flat VWAP and low volume provided reasons to be cautious about treating any individual crossover as meaningful by itself.
Volume expands around 7:30 a.m.
At approximately 7:30 a.m. (Chicago/Central time), price moved sharply lower and volume expanded considerably compared with the preceding overnight bars.
The observable conditions changed:
- Price moved decisively below rolling VWAP.
- VWAP began turning lower.
- Volume increased relative to the preceding bars.
- The market moved outside its earlier overnight range.
This combination showed that the decline was accompanied by substantially greater trading activity than the quiet overnight trading.
It did not guarantee that prices would continue falling. It also did not mean a trader should automatically enter after a large price move. Entry price, volatility and risk still needed to be considered.
The indicators simply showed that the character of the market had changed.
Another increase in activity near the cash-market open
Volume expanded again around the 8:30 a.m. (Chicago/Central time) cash-market open.
Price temporarily moved back toward the rolling VWAP before resuming its decline. This portion of the chart demonstrates why a VWAP touch or crossover should not be treated as a complete trading signal.
A trader evaluating that rebound could have asked:
- Did price remain above VWAP?
- Did VWAP stop declining?
- Did the market begin forming higher highs and higher lows?
- Did volume support a sustained change in direction?
In this case, the rebound did not immediately change the broader condition. Price returned below VWAP while the rolling VWAP continued lower.
Temporary VWAP tests during the decline
The chart contains several rebounds as the market moved lower during the day. Price approached or briefly moved across the rolling VWAP but those tests did not immediately produce a lasting change in direction.
A single crossover did not erase the preceding price structure or turn the VWAP higher.
This is an important practical use of the indicator. Instead of reacting to the first crossover, traders can watch what happens afterward.
- Does price remain on the new side of VWAP?
- Does the VWAP slope change?
- Does volume expand as the market attempts to establish a new direction?
These questions provide more information than the crossover by itself.
Conditions begin changing late in the session
During the late afternoon, price rallied from the session lows and moved above the rolling VWAP.
The VWAP flattened and began turning higher. Price also spent more time above the line than it had during some of the earlier rebounds.
This presented a different condition from the earlier portion of the decline.
It did not prove that a lasting reversal had begun. It showed that traders needed to update their assessment rather than remain committed to the conditions that existed earlier in the day.
A market can change from trending to consolidating or from declining to recovering. Traders should recognize when market conditions are changing without assuming the new direction will continue.
Volume increases sharply around the cash-market close
Volume expanded significantly again during the completed five-minute bar beginning at 3:00 p.m. (Chicago/Central time).
This is another example of why time of day matters when interpreting volume. Trading activity often changes around market openings, closings and scheduled events.
The large closing volume bar should not automatically be interpreted as confirmation of either a bullish or bearish outlook. It shows that substantially more contracts traded around the cash-market close.
The 3:05–3:10 p.m. bar was still forming when the screenshot was captured at 3:08 p.m. (Chicago/Central time), so it was excluded from the comparison.
Four Market Conditions to Monitor
The analysis can be summarized with four common conditions.
1) Price above a rising VWAP with higher volume
Price is trading above its recent volume-weighted average while that average is rising. Higher volume indicates that the movement is attracting more activity than the recent rolling average.
This setup may indicate that increasing volume is supporting the move higher. It does not guarantee that the move will continue.
2) Price below a declining VWAP with higher volume
Price is trading below its recent volume-weighted average while VWAP is declining. Higher volume indicates increased activity during the move.
This setup may indicate that increasing volume is supporting the move lower. It does not mean a trader should enter after an extended move without considering risk and entry location.
3) Price Moves Away from VWAP on lower volume
Price may move substantially away from VWAP while volume remains below its recent average. In this situation, volume is not confirming the strength of the price move. That does not mean the move must reverse, but it may give a trader reason to wait for additional confirmation before acting on price direction alone.
4) Price repeatedly crosses a relatively flat VWAP
Repeated crossings of a flat VWAP may indicate that the market lacks a sustained direction across the selected period.
This condition can produce several apparent signals that quickly reverse. VWAP should therefore be treated as a reference rather than a mechanical trading system.
Common Mistakes to Avoid
Treating every crossover as a signal
A crossover identifies a change in price relative to its rolling volume-weighted average. It does not establish that the change will continue.
Evaluate the overall VWAP slope, price structure and volume before deciding what the crossover means.
Comparing an incomplete volume bar with completed bars
Volume accumulates throughout the bar. A partially formed five-minute bar should not be compared directly with completed five-minute bars.
Ignoring the time of day
A 14-period SMAV compares a volume bar with the recent 14-bar average. It does not compare the bar with the same time on previous trading days.
A volume increase at the cash-market open or close may be normal for that time of day even when it is far above the recent rolling average.
Forgetting that period length changes with the timeframe
Fourteen periods represent 70 minutes on a five-minute chart but 210 minutes on a 15-minute chart.
Reconsider the indicator settings whenever you change the chart timeframe.
A Repeatable InsigniaTrader Checklist
Before drawing a conclusion from VWAP and volume, ask:
- What chart timeframe am I using?
- How much time does my selected VWAP period represent?
- Is price above, below or crossing VWAP?
- Is VWAP rising, declining or relatively flat?
- Is the most recently completed bar’s volume above or below its rolling average?
- Do price, VWAP and volume present a consistent picture?
- Is the current volume bar complete?
- Is the market near an opening, closing, scheduled event or market report?
- What price behavior would show that my interpretation is wrong?
- Have I defined my risk before considering a position?
This checklist does not produce an automatic trade. It organizes information already available on the chart so traders can evaluate market conditions and make more informed trade decisions.
Use VWAP and Volume for Context, Not Certainty
Rolling VWAP shows where price is trading relative to its recent volume-weighted average. Volume shows the amount of activity within each bar. SMAV provides a rolling comparison for that activity.
Used together, these indicators can help futures traders answer a technical question:
Is the current price move attracting greater trading activity or is price moving without a corresponding increase in volume?
The general idea behind using volume indicators is to determine whether increased trading activity is helping to confirm price movement.
Rising volume may provide additional confirmation that greater trading activity is accompanying the move. Lower volume may indicate that the price move lacks that confirmation. Neither condition makes the trading decision for you, but both can help you evaluate the move with a clearer understanding of the activity behind it.
To learn more about InsigniaTrader or our futures trading services – reach out to us at 1-847-379-5000 or leave a comment below.
Best wishes,

Joe Fallico
Principal Futures Broker
Series 3 & Series 30 Registered
Phone: 1-847-379-5000 ext. 101
Insignia Futures & Options, Inc.
Ready to Start Trading Futures?